Industrial and export agriculture
Industrial and export agriculture plays a significant role in the Ivorian economy, contributing an estimated 7.8% of GDP and 54.6% of the value added in the primary sector in 2023.
The government's overall vision in this area is to promote "sustainable, competitive Ivorian agriculture that creates wealth equitably shared." In this context, a first National Agricultural Investment Program, mobilizing 1,600 billion CFA francs out of 2,040 billion CFA francs, was implemented during the period 2012 – 2017 (PNIA 1), followed by a second program, PNIA 2, covering the period 2018 – 2025.
PNIA 2, which has a cost of 12,315 billion CFA francs divided between public (35%) and private (65%) investments, is a key driver in the transformation of agricultural products and agricultural development.
The development strategy is based on:
- the grouping of different regions of the country into Agro-Poles based on agro-ecological, administrative, social, and economic criteria;
- the promotion of sustainable agriculture.
Characterization of Agro-Poles
An Agro-Pole is a grouping based on agro-ecological criteria, allowing crops that require similar climatic conditions to be prioritized in the same areas. It enables producers to benefit from specific government services such as extension services, subsidies, and input distribution.
Since 2019, nine (9) Agro-Poles have been identified based on these groupings. The map below (Figure 1) illustrates the proposed zoning and the relevant industrial export crops (Table 1).
To date, two (2) of these Agro-Poles are being implemented with public funding of 247.4 billion CFA francs. These are:
- Agro-Pole 4 through the Agro-Industrial Poles Project - 2PAI-Center for an amount of 80 billion CFA francs;
- Agro-Pole 1 through the Agro-Industrial Poles Project - 2PAI-North for an amount of 167.4 billion CFA francs.
They have mobilized over 200 million dollars in investments, thus fostering the emergence of new agro-industrial enterprises and job creation. These Agro-Poles, as pillars of PNIA 2, have seen their operations intensify, with a focus on crop diversification, farmer training, access to agricultural inputs, storage of products in food product grouping centers, and especially product transformation.
Map of Agro-Poles in Côte d'Ivoire
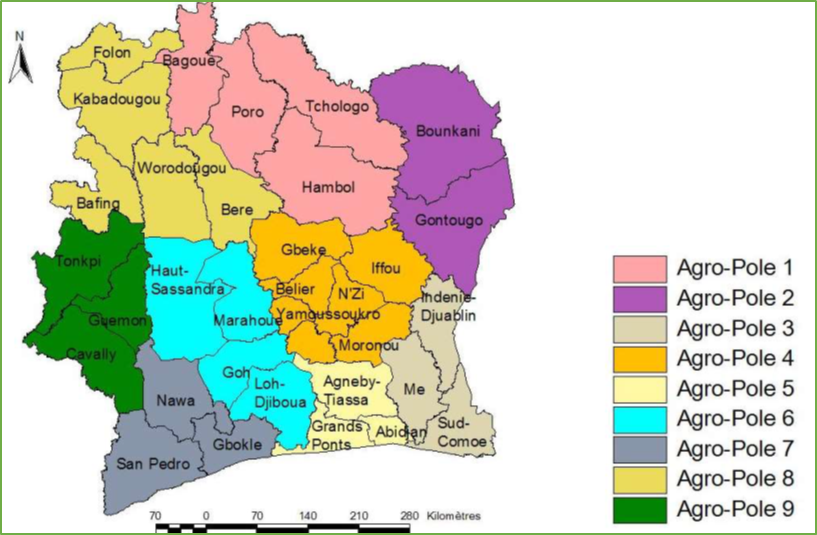
Sources: MEMINADERPV/DSDI
Main industrial and export crops of the Agro-Poles
| Zones | Relevant industrial and export crops | Status |
| Agro-Pole 1 | Cotton, Cashew, Mango, Banana, Sugarcane | In operation |
| Agro-Pole 2 | Cashew | Expected start in 2025 |
| Agro-Pole 3 | Coffee, Cocoa, Rubber, Oil Palm | Funding search ongoing |
| Agro-Pole 4 | Coffee, Cocoa, Cashew | In operation |
| Agro-Pole 5 | Rubber, Oil Palm, Cocoa | Funding search ongoing |
| Agro-Pole 6 | Cocoa, Cashew, Citrus | Funding search ongoing |
| Agro-Pole 7 | Cocoa, Coffee, Rubber, Oil Palm | Funding search ongoing |
| Agro-Pole 8 | Cashew, Cotton | Funding search ongoing |
| Agro-Pole 9 | Coffee, Cocoa | Funding search ongoing |
Sources: MEMINADERPV/DSDI
Production of industrial and export crops
The main industrial and export crops are: coffee, cocoa, rubber, oil palm, cotton, cashew, banana, pineapple, mango, and sugarcane.
- Cocoa and coffee
The cocoa-coffee duo represents an essential pillar of the Ivorian economy. Aware of its predominant role in the economy, the Ivorian government has undertaken a series of reforms, notably the establishment of the Coffee-Cocoa Council (CCC) as the sole regulatory body for the sector.
- Cocoa
As of the end of 2023, Côte d'Ivoire remains the world's leading producer and exporter of cocoa beans. However, cocoa cultivation is subject to several factors that have limited its growth in 2023.
After surpassing two (2) million tons during the period 2017-2022, thanks to increased yields linked to the introduction of new, more productive varieties and the entry into production of new plantations, production was recorded at 1,822,320 tons in 2023, down 22.7% compared to 2022. This is due to unfavorable climatic factors, particularly excessive rainfall in cocoa-growing areas.
Furthermore, to promote remunerative farm gate prices, Côte d'Ivoire and Ghana have committed to enhancing their cooperation in production since 2021. Thus, Côte d'Ivoire aims to limit its production to two million tons. Consequently, the government has reduced the distribution of seeds and is combating the development of plantations in classified forests.
The quality of production has significantly improved since 2015 thanks to the control and monitoring system put in place, coupled with training for producers in good agricultural practices.
Statistics on cocoa beans
2015 | 2016 | 2017 | 2018 | 2019 | 2020 | 2021 | 2022 | 2023 | |
| Production (in thousands of tons) | 1826.1 | 1634.3 | 2033.5 | 2112.5 | 2235.7 | 2172.7 | 2228.4 | 2358.9 | 1822.4 |
| Cultivated area (ha) | ND | ND | ND | ND | 3,516,521 | 3,513,775 | 3,577,495 | 3,562,237 | 3,564,372 |
| Variation in % | NC | -10.5 | 24.4 | 3.9 | 5.8 | -2.8 | 2.6 | 5.9 | -22.7 |
| Quantity of cocoa beans processed | 527.9 | 491.5 | 577.0 | ND | 604.8 | 596.4 | 619.5 | 636.9 | 790.8 |
| Variation in % | AD | -6.9 | 17.4 | ND | ND | -1.4 | 3.9 | 2.8 | 24.2 |
| Transformation rate (%) | 29 | 30 | 28 | ND | 27 | 28 | 28 | 27 | 34 |
Sources: MEMINADERPV; CCC
- Rubber and oil palm
The rubber and oil palm sectors are important parts of Ivorian agriculture. These two products play a significant role in industrial activity as they have the highest transformation rates among the crops in industrial and export agriculture.
The regulation of the rubber and oil palm sectors has been ensured by the Rubber and Oil Palm Council (CHPH) since 2017.
- Rubber
Côte d'Ivoire is the leading producer of rubber in Africa. From 2015 to 2023, rubber production quadrupled to reach 1,678,061.8 tons in 2023 compared to 350,309 tons in 2015. It benefits from promotional actions by the Rubber Development Fund (FDH).
The transformation rate of rubber into semi-finished products was 100% until 2015. Since then, with the "boom" in production, processing capacities have proven insufficient. Thus, the transformation rate has dropped to 80%, leading to the establishment of operators as buyers of wet rubber for direct export.
To strengthen transformation, the government decided, through ordinance 2019-826 of October 9, 2019, to establish specific tax incentives for investments made in the rubber transformation sector.
- Oil Palm
Production of oil palm bunches has increased by an average of 4.8% annually from 2015 to 2023. It benefits from: (i) the provision of improved seedlings to producers based on a subsidy mechanism; (ii) the establishment of a financing mechanism for fertilizers for oil palm producers; (iii) funding for basic social infrastructure (schools, boreholes, health centers, etc.).
National production of oil palm bunches is entirely processed on-site into crude oil by forty-four (44) first transformation units. A second transformation is done locally by the four (4) main industries. The products derived from this second transformation are sold on the national market (75%) and on the sub-regional market - UEMOA zone (25%).
Production of palm oil has increased by an average of 2.9% annually from 2015 to 2023.
Evolution of the production of dry rubber, oil palm bunches, and palm oil (in thousands of tons)
2015 | 2016 | 2017 | 2018 | 2019 | 2020 | 2021 | 2022 | 2023 | |
| Dry rubber | 350.3 | 453 | 606.4 | 624.1 | 780.1 | 949.3 | 1100.4 | 1,320.1 | 1,678.1 |
| Palm bunch | 1,788.8 | 2,018.7 | 2,281.6 | 2,336 | 2,445 | 2,346.7 | 2,762.6 | 2,489.4 | 2,605.7 |
| Crude palm oil | 447.2 | 453.2 | 482 | 513.9 | 535.4 | 514.5 | 601.3 | 541.5 | 562.6 |
Sources: MEMINADERPV; CHPH
Cultivated area (in hectares)
2015 | 2016 | 2017 | 2018 | 2019 | 2020 | 2021 | 2022 | 2023 | |
| Rubber tree | ND | ND | ND | ND | 701 481,0 | 703 696,0 | 722 502,0 | 722 502,7 | 722 502,7 |
| Oil palm | ND | ND | ND | ND | 334 520,0 | 334 520,0 | 352 918,3 | 352 918,3 | 352 918,3 |
Sources: MEMINADERPV; CHPH
Cotton and cashew
Cotton and cashew occupy an important place in industrial and export agriculture. These two crops are primarily cultivated in the North and Central regions of the country. However, for cashew, there is a significant presence in the East. Cotton is an annual crop that has a very elaborate organizational scheme that allows for better support of producers. The cashew tree contributes to the fight against desert encroachment in the northern part of the country and has become the main cash crop in this area.
The regulation of both sectors is ensured by the Cotton and Cashew Council (CCA).
- Cotton
Cotton seed production has experienced a continuous increase since the 2015/2016 season, with production rising from 310,177 tons to 539,623 tons in 2021/2022, representing an average annual increase of 9.7% over the period. However, in July 2022, attacks by "jassids" (Amrasca biguttula) in the cotton basin led to a 56.2% decrease in production for the 2022/2023 season compared to the previous season, bringing it down to 236,628 tons.
A gradual recovery is being observed in the 2023/2024 season, with production increasing by 47.0%.
- cashew
Regarding cashew nut production, it has increased by an average of 7.2% annually over the period from 2015 to 2023, reaching 1,225,935 tons in 2023. This growth has benefited from favorable climatic conditions and good agricultural practices that have improved orchard yields.
Statistics on cottonseed
2014/2015 | 2015/2016 | 2016/2017 | 2017/2018 | 2018/2019 | 2019/2020 | 2020/2021 | 2021/2022 | 2022/2023 | |
| Productions (in thousands of tons) | 450,1 | 310,2 | 328,1 | 412,6 | 469,0 | 490,4 | 559,5 | 539,6 | 236,6 |
| Cultivated area (ha) | ND | ND | ND | ND | 392 165 | 408 526 | 444 870 | 475 654 | 410 683 |
Sources: MEMINADERPV; CCA undefined
Statistics on cashew nuts
2015 | 2016 | 2017 | 2018 | 2019 | 2020 | 2021 | 2022 | 2023 | |
| Productions (in thousands of tons) | 702,5 | 649,6 | 711,2 | 761,3 | 634,6 | 848,7 | 968,7 | 1 028,2 | 1 225,9 |
| Cultivated area (ha) | ND | ND | ND | ND | 1 363 534 | 1 400 000 | 1 407 000 | 1 414 000 | 1 421 105 |
Sources: MEMINADERPV; CCA
Fruit crops
Dessert bananas are the main fruit export crop of Côte d'Ivoire, followed by mangoes and pineapples. Côte d'Ivoire is the leading African producer of dessert bananas and the top African exporter of mangoes.
Between 2015 and 2023, the production of dessert bananas, mangoes, and pineapples recorded average annual growth rates of (+6.1%), (+10.7%), and (-8.2%), respectively.
Evolution of fruit crop production (in thousands of tons)
2015 | 2016 | 2017 | 2018 | 2019 | 2020 | 2021 | 2022 | 2023 | |
| Mango | 79,8 | 100,0 | 120,0 | 120,0 | 120,0 | 120,0 | 180,0 | 180,0 | 180,0 |
| pineapple | 49,8 | 38,9 | 40,0 | 45,0 | 40,0 | 40,0 | 39,9 | 54,0 | 23,6 |
| Banana dessert | 529,7 | 345,7 | 385,0 | 396,0 | 527,0 | 480,0 | 550,0 | 651,5 | 850 |
Sources: Central Organization of Pineapple and Banana Producers and Exporters (OCAB); Organization of Producers and Exporters of Bananas, Pineapples, Mangoes, and Other Fruits of Côte d'Ivoire (OBAM-CI).
Reference documents:
- Strategic Orientations PND 2021-2025, Volume 2
- PNIA Report 2, September 2017
- Report PNIA 2, September 2023
- Agricultural Statistics Directory, 2019 – 2021 Edition
Directory of Agricultural Statistics, 2022-2023 Edition