Foreign exchange regulation
Here is the translation of the provided text into English:
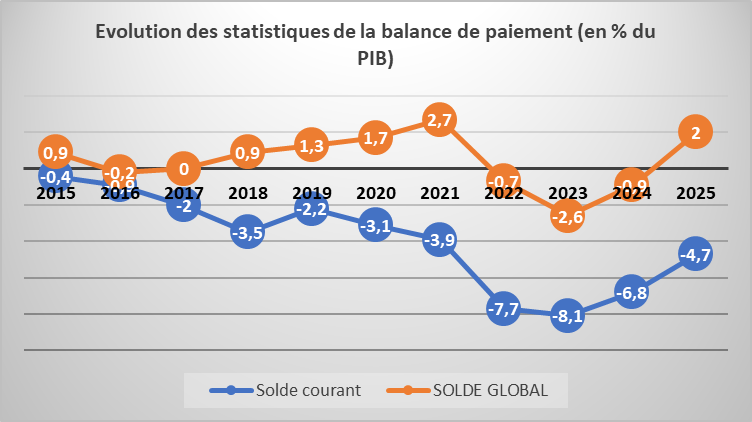
- Current account deficit generally controlled, despite a deterioration in 2022 and 2023,
- Overall balance generally in surplus
Sources: BCEAO, MEPD/DGE
Evolution of balance of payments statistics (as a % of GDP)
| 2015 | 2016 | 2017 | 2018 | 2019 | 2020 | 2021 | 2022 | 2023 | 2024 | 2025 |
CURRENT BALANCE | -0.4 | -0.9 | -2.0 | -3.5 | -2.2 | -3.1 | -3.9 | -7.7 | -8.1 | -6.8 | -4.7 |
Trade Balance | 2.5 | 2.2 | 1.9 | 0.2 | 1.5 | 0.9 | 0.1 | -3.9 | -3.7 | -2.3 | -0.1 |
Goods | 6.9 | 6.3 | 6.4 | 4.2 | 5.2 | 4.7 | 4.2 | 1.5 | 2.1 | 3.7 | 5.2 |
Export | 25.6 | 22.5 | 22.6 | 20.4 | 20.9 | 19.8 | 21.0 | 23.2 | 21.6 | 23.0 | 23.4 |
Import | 18.7 | 16.1 | 16.2 | 16.2 | 15.7 | 15.1 | 16.9 | 21.7 | 19.6 | 19.4 | 18.2 |
Services | -4.4 | -4.1 | -4.5 | -4.0 | -3.7 | -3.8 | -4.1 | -5.4 | -5.8 | -6.0 | -5.3 |
Primary Income | -2.2 | -2.2 | -2.9 | -2.8 | -2.8 | -2.9 | -3.1 | -3.3 | -4.0 | -4.1 | -4.2 |
Secondary Income | -0.8 | -0.9 | -1.0 | -1.0 | -1.0 | -1.1 | -0.9 | -0.5 | -0.4 | -0.3 | -0.4 |
CAPITAL BALANCE | 0.6 | 0.4 | 0.4 | 0.3 | 0.3 | 0.3 | 0.2 | 0.1 | 0.2 | 0.1 | 0.1 |
FINANCIAL ACCOUNT BALANCE | -0.9 | -0.3 | -1.6 | -4.5 | -3.3 | -4.5 | -6.4 | -6.9 | -5.3 | -5.8 | -6.6 |
Direct Investment | -1.0 | -1.1 | -0.6 | -0.8 | -1.2 | -1.1 | -1.5 | -2.0 | -2.1 | -4.1 | -4.2 |
Portfolio Investment | -2.1 | -1.2 | -2.6 | -2.7 | 0.0 | -1.5 | -1.9 | -0.4 | 0.0 | -4.6 | -0.9 |
Other Investments | 2.2 | 2.0 | 1.5 | -1.0 | -2.0 | -1.9 | -3.0 | -4.4 | -3.1 | 2.9 | -1.4 |
GLOBAL BALANCE | 0.9 | -0.2 | 0.0 | 0.9 | 1.3 | 1.7 | 2.7 | -0.7 |
|