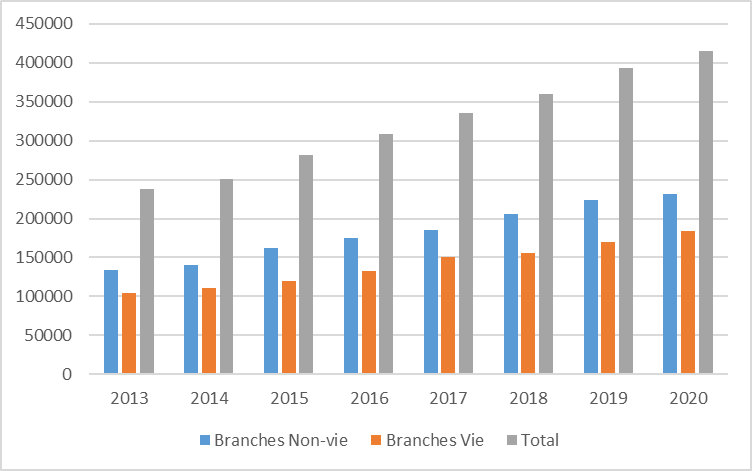
The insurance market in Côte d'Ivoire is experiencing significant growth. The revenue, which has been steadily increasing, reached 414.7 billion FCFA in 2020. The benefits have seen a similar trend up until 2019. In 2020, the benefits provided to customers amounted to 392.3 billion FCFA.
Evolution of the activity of insurance companies (in millions of FCFA)
|
Items |
2013 |
2014 |
2015 |
2016 |
2017 |
2018 |
2019 |
2020 |
|
Net premium income (Revenue) |
237,972 |
251,207 |
281,719 |
308,188 |
335,223 |
360,525 |
393,956 |
414,685 |
|
Net financial products |
20,732 |
25,000 |
31,327 |
23,350 |
32,352 |
26,291 |
30,105 |
26,868 |
|
Commissions received |
5,222 |
6,124 |
6,480 |
5,374 |
6,951 |
7,707 |
8,805 |
10,720 |
|
Benefits |
208,176 |
259,128 |
271,064 |
291,975 |
304,339 |
346,167 |
410,945 |
392,347 |
|
Premiums ceded to reinsurers |
39,427 |
45,190 |
49,572 |
49,848 |
55,772 |
53,344 |
61,892 |
69,819 |
|
Other net charges |
51,047 |
59,965 |
62,167 |
61,476 |
70,588 |
73,330 |
77,666 |
80,415 |
|
Commissions paid |
23,720 |
28,316 |
31,214 |
35,298 |
36,132 |
39,080 |
42,987 |
45,402 |
Source: Source: MFB/DGTCP
Revenue evolution by branch (in millions of FCFA)

Source: Source: MFB/DGTCP
The revenue is largely generated by the Non-life branches (56.3% of the average share during the period 2013-2020).
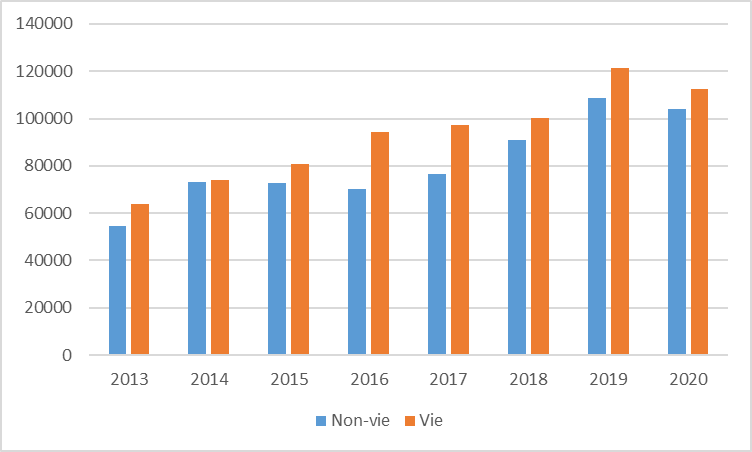
Evolution by branch of benefits provided to customers (in millions of FCFA)

Source: Source: MFB/DGTCP
The Life branches provide relatively more benefits to customers despite lower revenue compared to the Non-life branches (See graph).
In the course of their activities, insurance companies have made cumulative investments amounting to 963.6 billion FCFA in 2020 compared to 550.0 billion in 2013, nearly doubling.
Coverage rate of regulated commitments
|
Items |
2013 |
2014 |
2015 |
2016 |
2017 |
2018 |
2019 |
2020 |
|
Insurance companies |
29 |
29 |
27 |
31 |
31 |
33 |
33 |
33 |
|
Regulated commitments (RC) in millions of FCFA |
537,403 |
582,688 |
611,754 |
698,764 |
726,951 |
758,781 |
777,217 |
897,611 |
|
Cumulative investments (in millions of FCFA) |
549,960 |
588,310 |
624,440 |
705,181 |
757,090 |
803,881 |
897,395 |
963,606 |
|
Coverage rate of RC (%) |
102 |
101 |
102 |
101 |
104 |
106 |
115 |
107 |
Source: MFB/DGTCP
The coverage rates of regulated commitments are satisfactory (>100%), although with low margins (107% in 2020); this indicates that safe, profitable, and liquid cumulative investments cover the regulated commitments of the branches (See Table).
Here is the translation of the provided text into English:
SYNTHESIS OF NON-LIFE (IARD) BRANCH DATA OF THE IVORIAN MARKET
(Evolution from 2013 to 2020, amounts in millions of FCFA)
|
Items |
2013 |
2014 |
2015 |
2016 |
2017 |
2018 |
2019 |
2020 |
|
|
Net Premiums Written (Revenue) |
133,424 |
139,861 |
161,843 |
175,414 |
184,737 |
205,465 |
223,698 |
231,006 |
|
|
Net Financial Income |
5,885 |
7,002 |
7,208 |
6,669 |
7,925 |
7,450 |
13,708 |
7,441 |
|
|
Commissions Received |
4,962 |
5,585 |
5,757 |
4,746 |
6,062 |
6,845 |
8,025 |
9,884 |
|
|
Benefits |
Claims Paid |
51,009 |
75,552 |
74,864 |
73,949 |
79,702 |
97,391 |
112,404 |
108,683 |
|
Claims Paid Net of Recourse |
54,514 |
73,101 |
72,668 |
70,305 |
76,347 |
90,763 |
108,525 |
104,089 |
|
|
Premiums Ceded to Reinsurers |
35,565 |
40,699 |
45,314 |
45,100 |
48,703 |
48,660 |
57,577 |
64,682 |
|
|
Other Net Charges |
33,344 |
38,560 |
38,614 |
37,459 |
45,420 |
46,429 |
48,548 |
49,947 |
|
|
Commissions Paid |
17,542 |
20,804 |
23,079 |
26,640 |
26,512 |
29,220 |
32,025 |
32,544 |
|
|
Regulated Commitments (ER) |
PREC (1) |
12,495 |
15,059 |
19,347 |
33,879 |
24,388 |
28,487 |
19,712 |
25,259 |
|
PSAP(2) |
139,743 |
149,839 |
141,544 |
148,194 |
170,532 |
161,845 |
124,673 |
173,300 |
|
Source: MFB/DGTCP
(1) Provision for Ongoing Risks
(2) Provisions for Claims to be Paid
SYNTHESIS OF LIFE BRANCH DATA OF THE IVORIAN MARKET
(Evolution from 2013 to 2020, amounts in millions of FCFA)
|
Items |
2013 |
2014 |
2015 |
2016 |
2017 |
2018 |
2019 |
2020 |
|
|
Net Premiums Written (Revenue) |
104,548 |
111,346 |
119,876 |
132,774 |
150,486 |
155,060 |
170,258 |
183,678 |
|
|
Net Financial Income |
14,847 |
17,999 |
24,119 |
16,681 |
24,428 |
18,841 |
16,397 |
19,427 |
|
|
Commissions Received |
260 |
539 |
723 |
628 |
889 |
862 |
780 |
836 |
|
|
Benefits |
Due |
64,026 |
74,184 |
80,773 |
94,318 |
97,157 |
100,109 |
121,552 |
112,381 |
|
including Buybacks |
38,626 |
36,291 |
42,759 |
53,404 |
51,133 |
57,904 |
68,465 |
67,194 |
|
|
Premiums Ceded to Reinsurers |
3,861 |
4,490 |
4,258 |
4,748 |
7,069 |
4,684 |
4,315 |
5,138 |
|
|
Other Net Charges |
17,703 |
21,405 |
23,553 |
24,017 |
25,168 |
26,901 |
29,119 |
30,469 |
|
|
Commissions Paid |
6,178 |
7,512 |
8,135 |
8,658 |
9,621 |
9,860 |
10,962 |
12,858 |
|
|
Regulated Commitments (ER) |
Math. Prov. |
332,808 |
362,986 |
393,746 |
444,023 |
475,122 |
527,616 |
530,042 |
630,199
|
|
Other Commitments |
52,357 |
54,804 |
57,118 |
72,667 |
56,910 |
40,833 |
102,789 |
68,853 |
|
Source: MFB/DGTCP
Synthesis of Ivorian Market Data (in millions of FCFA)
|
Items |
2013 |
2014 |
2015 |
2016 |
2017 |
2018 |
2019 |
2020 |
|
Net Premiums Written (Revenue) |
237,972 |
251,207 |
281,719 |
308,188 |
335,223 |
360,525 |
393,956 |
414,685 |
|
Net Financial Income |
20,732 |
25,000 |
31,327 |
23,350 |
32,352 |
26,291 |
30,105 |
26,868 |
|
Commissions Received |
5,222 |
6,124 |
6,480 |
5,374 |
6,951 |
7,707 |
8,805 |
10,720 |
|
Benefits |
208,176 |
259,128 |
271,064 |
291,975 |
304,339 |
346,167 |
410,945 |
392,347 |
|
Premiums Ceded to Reinsurers |
39,427 |
45,190 |
49,572 |
49,848 |
55,772 |
53,344 |
61,892 |
69,819 |
|
Other Net Charges |
51,047 |
59,965 |
62,167 |
61,476 |
70,588 |
73,330 |
77,666 |
80,415 |
|
Commissions Paid |
23,720 |
28,316 |
31,214 |
35,298 |
36,132 |
39,080 |
42,987 |
45,402 |
|
Regulated Commitments (ER) |
537,403 |
582,688 |
611,754 |
698,764 |
726,951 |
758,781 |
777,217 |
897,611 |
|
Cumulative Investments |
549,960 |
588,310 |
624,440 |
705,181 |
757,090 |
803,881 |
897,395 |
963,606 |
|
Securities |
249,427 |
267,211 |
281,876 |
307,464 |
338,187 |
371,117 |
401,053 |
481,404 |
|
Real Estate Rights |
93,496 |
90,767 |
88,058 |
102,991 |
107,708 |
112,147 |
108,622 |
116,994 |
|
Bank Deposits |
153,310 |
181,221 |
200,211 |
242,400 |
234,209 |
239,841 |
271,767 |
282,350 |
|
Other Admissible Assets |
53,727 |
49,110 |
54,294 |
52,326 |
76,985 |
80,776 |
115,952 |
82,858 |
|
ER Coverage Rate |
102% |
101% |
102% |
101% |
104% |
106% |
115% |
107% |
|
Number of Companies (1) |
29 |
29 |
27 |
31 |
31 |
33 |
33 |
33 |
Source: MFB/DGTCP
(1) This refers to companies that have reported their figures; the number of companies does not account for those that have not closed their first financial year by December 31 of the inventory year.
|
Designation |
Download |
|
Evolution of Synthetic Balances |
|
|
Evolution of Items by Non-Life Branches |
|
|
Evolution of Items by Life Branches |
|
|
Evolution of Revenue |
|
|
Synthesis of Market Data 2020 |
