The Ivorian economy has experienced significant dynamism, marked by an average real GDP growth rate of 6.5% during the period from 2016 to 2019, thanks to substantial public and private investments. In nominal terms, these investments increased from 6,117.4 billion CFA francs in 2016 to 7,922.8 billion CFA francs in 2020.
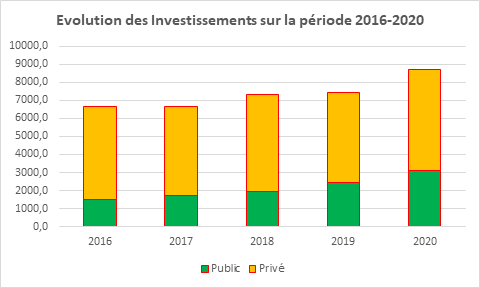
Source: MEF/DGE/, INS
The current development policy of the country is outlined in the National Development Plan (PND) 2021-2025, which is estimated at 59,000 billion CFA francs. The expected contribution from the private sector represents 43,660 billion CFA francs, or 74% of the total.
Several structural projects are planned to be implemented with the support of the private sector.
For more information: www.gcpnd.gouv.ci
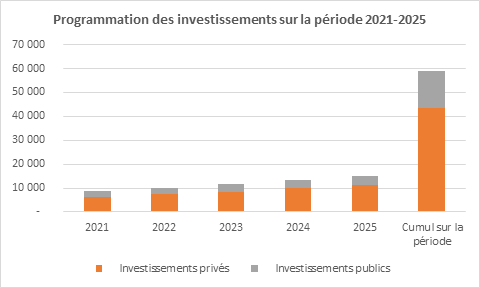
Source: MPD
Trend of FDI in Côte d'Ivoire
Côte d'Ivoire recorded a sustained average growth of incoming FDI flows of 26% between 2015 and 2021. Thus, the incoming FDI flow more than doubled during this period, reaching 772.1 billion CFA francs in 2021. With nearly 30% of the total FDI stock of the UEMOA, the country is the leading nation in the West African franc zone and the 3rd in ECOWAS after Nigeria and Ghana.
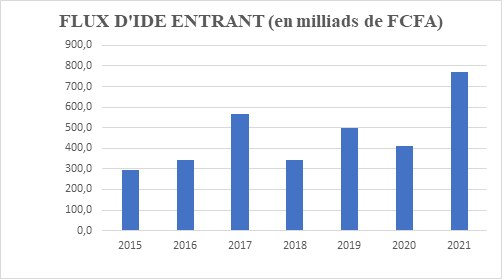
Source: BCEAO
Approved investments have more than tripled in a decade, rising from 219 billion in 2012 to 714 billion in 2022.
Table on Approved Investment Flows from 2012-2022
|
Investment Approval |
||||||||||||
|
Categories |
2012 |
2013 |
2014 |
2015 |
2016 |
2017 |
2018 |
2019 |
2020 |
2021 |
2022 |
TOTAL |
| Investment Volume (in billion CFA francs) |
219 |
514 |
426 |
670 |
672 |
466 |
703 |
730 |
632 |
642 |
714 |
6388 |
| FDI (in billion CFA francs) |
119 |
380 |
261 |
423 |
491 |
373 |
544 |
553 |
338 |
357 |
496 |
4335 |
| National Direct Investment (in billion CFA francs) |
100 |
134 |
165 |
247 |
181 |
93 |
159 |
177 |
294 |
285 |
218 |
2053 |
Source: CEPICI
Evolution of Approved FDIs from 2012 to 2022
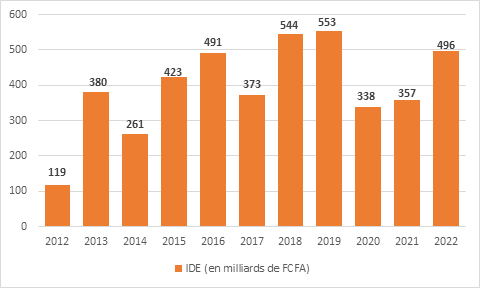
Source: CEPICI