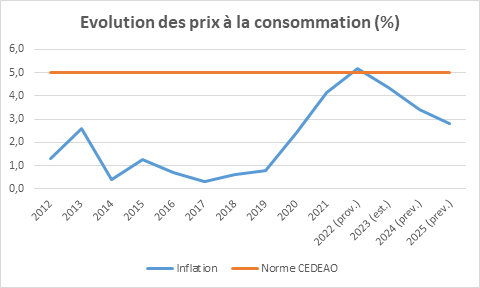
- Overall inflation contained below the ECOWAS community threshold of a maximum of 5%.

Sources: MEPD/DGE, ANStat
Evolution of Inflation
Historically, like other countries in the UEMOA, Côte d'Ivoire has been characterized by controlled inflation generally remaining below the community standard of a maximum of 3%.
However, in 2021, inflation was at 4.2% primarily due to the increase in prices of edible products (+7.4%). This trend was driven by food and non-alcoholic beverage prices, which rose from 3.2% in January 2021 to a peak of 12.3% in December.
This price increase is explained notably by (i) the decrease in food production following disruptions in planting in 2020 due to, on one hand, a rainfall deficit and, on the other hand, the absence of seasonal labor from neighboring countries due to the closure of land borders, (ii) insecurity in Sahelian countries causing difficulties in the supply of livestock and vegetable products, (iii) the increase in import prices of fish (+11.9%), and (iv) the rise in palm oil prices on the international market (+61.2%).
Inflation rose to 5.2% in 2022 after 4.2% in 2021, exceeding the community threshold of a maximum of 3%, despite measures to combat the high cost of living. This increase is linked, on one hand, to disruptions in supply chains caused by various crises, notably the Ukrainian crisis, and on the other hand, to high energy prices that remained elevated in 2022. Furthermore, the local supply deficit in agricultural production during the 2021/2022 campaign and the worsening security risks in neighboring countries continue to affect the normal supply of markets with food products, thereby amplifying price pressures.
In 2023, inflation evolved to 4.4%, related to the rising costs of energy and food products.
During the period 2024-2025, inflation is expected to decline steadily, from 3.4% in 2023 to 2.8% in 2025, thanks in particular to the increase in the supply of food products, continued improvement in distribution channels and agricultural access routes, better market supply, and the government's policy to combat the high cost of living.
Evolution of Inflation
|
Year |
2016 |
2017 |
2018 |
2019 |
2020 |
2021 |
2022 |
2023 |
2024 (est.) |
2025 (est.) |
|
|
def. |
def. |
def. |
def. |
def. |
def. |
prov. |
est. |
prev. |
prev. |
|
Inflation Rate |
0.7 |
0.3 |
0.6 |
0.8 |
2.4 |
4.2 |
5.2 |
4.4 |
3.7 |
2.5 |
Sources: MEPD/DGE, ANStat
