The Government aims to make Côte d'Ivoire one of the leading energy markets in sub-Saharan Africa by 2030. To realize this vision, several sectoral reforms have been implemented from 2016 to 2022, notably the adoption of Law No. 2014-132 of March 24, 2014, which establishes the electricity code.
Under this law, the activities of production, transportation, distribution, importation, exportation, and marketing of electrical energy do not constitute a monopoly of the State but are considered public services.
On the other hand, dispatching activities constitute a state monopoly that may be granted to a single operator. Dispatching is the activity that involves maintaining the balance between supply and demand, ensuring control of the voltage plan, and managing the transit of electrical energy on national networks and interconnections.
Institutional Framework of the Electricity Sector
|
ACTORS IN THE SECTOR |
ROLE |
NATURE OF POSITIONING IN THE SECTOR |
|
STATE OF CÔTE D'IVOIRE |
Develop the National Policy for the development of the sector |
Contracting Authority |
|
CI-ENERGIES |
Ensure project management of sector works |
State-owned company |
|
ANARE |
Regulate the sector |
State-owned company |
|
FOXTROT, CNR, PETROCI. |
Gas suppliers, providing natural gas to IPPs |
Take-or-pay natural gas purchase contract with CI-ENERGIES. |
|
CIPREL, AZITO, AGGREKO. |
Independent Power Producer (IPP) |
BOOT concession agreement for CIPREL and AZITO, and lease agreement for AGGREKO. |
|
CIE |
Concessionaire of public service for dispatching, transportation, distribution, and marketing of electricity |
Public service concession agreement signed with the State |
|
FINAL CONSUMER |
Consumption of electricity |
Subscription contract with CIE |
Source: Ministry of Mines, Petroleum, and Energy (MMPE)
The State's efforts to strengthen the governance framework have led to progress in both expanding production capacity through massive investments and achieving financial balance in the sector.
INFRASTRUCTURES
The production fleet consists of seven (7) hydroelectric dams (Ayamé 1, Ayamé 2, Kossou, Taabo, Buyo, Fayé, and Soubré), five (5) thermal power plants (Vridi 1, CIPREL, AZITO, AGGREKO, and KARPOWER), and one (1) solar power plant in BOUNDIALI. The electricity production capacity increased from 1,391 megawatts (MW) in 2011 to 2,907 MW in 2023, representing a growth of 89.2% over the period, with 879 MW from hydroelectric dams, 1,998 MW from thermal plants, and 30 MW from solar energy.
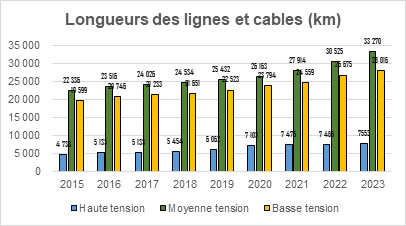
Furthermore, the strengthening of transportation and distribution infrastructures has allowed the sector to have, in 2023, 28,016 km of low voltage (BT) lines, 33,270 km of medium voltage (MT) lines, and 7,252 km of high voltage (HT) lines.

Source: Ministry of Mines, Petroleum, and Energy, CI-ENERGIES Yearbook
Lengths of lines and cables (km)
|
Year |
2015 |
2016 |
2017 |
2018 |
2019 |
2020 |
2021 |
2022 |
2023 |
|
High voltage |
4,733 |
5,133 |
5,133 |
5,454 |
6,062 |
7,103 |
7,475 |
7,485 |
7,553 |
|
Medium voltage |
22,336 |
23,516 |
24,026 |
24,534 |
25,432 |
26,163 |
27,914 |
30,525 |
33,270 |
|
Low voltage |
19,599 |
20,746 |
21,233 |
21,651 |
22,523 |
23,794 |
24,559 |
26,675 |
28,016 |
Source: Ministry of Mines, Petroleum, and Energy, CI-ENERGIES Yearbook
PERFORMANCE
- Strengthening Electrification
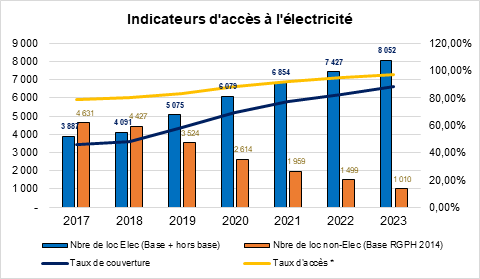
In terms of access to electricity, the continuation of the National Rural Electrification Program (PRONER) has enabled the electrification of 4,165 rural localities from 2017 to 2023, increasing the number of electrified localities from 3,887 in 2017 to 8,052 by the end of 2023.
Specifically, the number of electrified localities based on the 2014 RGPH increased from 3,887 to 7,508 in 2023, while in localities outside the 2014 RGPH base, it increased from 0 to 544 localities.
Thus, the coverage rate calculated based on the RGPH 2014 evolved from 45.63% in 2017 to 88.14% by the end of 2023, with 97% of the population having access to electricity.
Additionally, thanks to the operationalization of the Electricity for All Program (PEPT), 1,738,457 connections were made from 2014 to 2023.

* Populations of electrified localities / Total population; Population estimated considering the RGPH 2014
Source: Ministry of Mines, Petroleum, and Energy, CI-ENERGIES Yearbook
Indicators of Access to Electricity
|
Year |
2017 |
2018 |
2019 |
2020 |
2021 |
2022 |
2023 |
|
Total number of electrified localities i |
3,887 |
4,091 |
5,075 |
6,079 |
6,854 |
7,427 |
8,052 |
|
Number of electrified localities based on RGPH 2014 |
3,887 |
4,091 |
4,994 |
5,904 |
6,559 |
7,019 |
7,508 |
|
Number of non-electrified localities ii |
4,631 |
4,427 |
3,524 |
2,614 |
1,959 |
1,499 |
1,010 |
|
Coverage rate iii |
45.63% |
48.03% |
58.63% |
69.31% |
77.00% |
82.40% |
88.14% |
|
Access rate iv |
79% |
80% |
83% |
88% |
92% |
95% |
97% |
(i) Total number of electrified localities (according to RGPH 2014 base + outside 2014 base)
(ii) Number of non-electrified localities from the RGPH 2014 base
(iii) Number of electrified localities from the RGPH 2014 base / 8518 (Number of localities from the RGPH 2014 base)
(iv) Populations of electrified localities / Total population; Population estimated considering the RGPH 2014
Source: Ministry of Mines, Petroleum, and Energy, CI-ENERGIES Yearbook
- Reduction of Average Outage Time
With the implementation of the Project for the Development and Rehabilitation of the Electricity Network of Côte d'Ivoire (PRODERCI), the overall efficiency of the electrical system has significantly improved, rising from 78.78% in 2015 to 85.99% in 2023. Investments have reduced the average electricity outage time, which continuously decreased from 44 hours and 38 minutes in 2015 to 17 hours and 54 minutes in 2021. This average time increased to 29 hours and 36 minutes in 2023 due to disruptions in the electrical network.
- Increase in Production
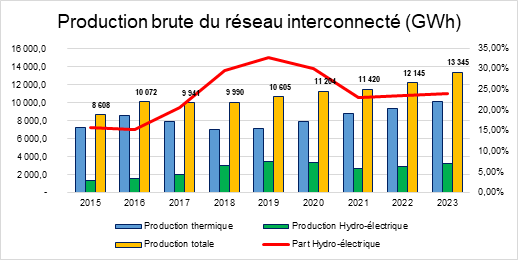
The gross electricity production has been continuously increasing since 2018, rising from 7,125 GWh to 13,345 GWh in 2023. Production is primarily driven by thermal power plants (75.82%) and hydroelectric plants (23.98%). Solar energy production is nearly marginal as of the end of 2023. The first solar power plant, with a capacity of 37.5 MWc, was commissioned in September 2023.

Source: Ministry of Mines, Petroleum, and Energy, CI-ENERGIES Yearbook
Gross Production of the Interconnected Electricity Network from 2015 to 2023 (GWh)
|
Year |
2015 |
2016 |
2017 |
2018 |
2019 |
2020 |
2021 |
2022 |
2023 |
|
Thermal Production |
7,255.40 |
8,543.30 |
7,893.60 |
7,028 |
7,125 |
7,828 |
8,793 |
9,281 |
10,119 |
|
Hydroelectric Production |
1,352.50 |
1,528.60 |
2,047.20 |
2,962 |
3,480 |
3,376 |
2,627 |
2,864 |
3,200 |
|
Solar Production |
- |
- |
- |
- |
- |
- |
- |
- |
25.8 |
|
Total Production |
8,607.90 |
10,071.90 |
9,940.80 |
9,990 |
10,605 |
11,204 |
11,420 |
12,145 |
13,345 |
|
Hydroelectric Share |
15.71% |
15.18% |
20.59% |
29.65% |
32.81% |
30.13% |
23.00% |
23.57 |
23.98 |
Source: Ministry of Mines, Petroleum, and Energy, CI-ENERGIES Yearbook
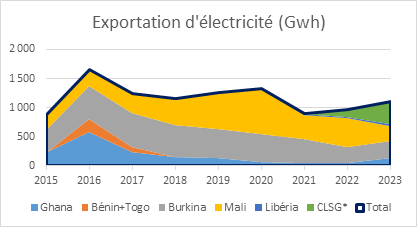
Côte d'Ivoire is a net exporter of electricity to neighboring countries, mainly Mali, Burkina Faso, and Ghana. In 2023, the share of exports in national production was around 8.2%.

Source : Ministry of Mines, Petroleum, and Energy, CI-ENERGIES Yearbook
Electricity Exports (GWh)
|
Year |
Ghana |
Benin + Togo |
Burkina |
Mali |
Liberia |
CLSG* |
Total |
|
2015 |
227 |
13 |
382 |
248 |
2 |
- |
872 |
|
2016 |
575 |
222 |
571 |
281 |
7 |
- |
1,656 |
|
2017 |
242 |
73 |
583 |
340 |
9 |
- |
1,247 |
|
2018 |
141 |
- |
561 |
444 |
10 |
- |
1,156 |
|
2019 |
127 |
- |
506 |
609 |
13 |
- |
1,255 |
|
2020 |
58 |
- |
489 |
768 |
18 |
- |
1,333 |
|
2021 |
43 |
- |
412 |
411 |
21 |
1.4 |
888 |
|
2022 |
58 |
|
281 |
497 |
26 |
134 |
973 |
|
2023 |
127 |
|
297 |
265 |
28 |
383 |
1,100 |
*CLSG Project: Electricity supply to Liberia, Sierra Leone, and Guinea
Source: MMEP
- Electricity Prices
In Côte d'Ivoire, electricity prices are regulated and set according to consumer categories (high, medium, or low voltage). The average selling price of electricity was set at 71 FCFA/kWh (excluding taxes) in 2023, compared to 68 FCFA/kWh in 2022. The Government adjusted electricity sales tariffs starting July 1, 2023, which involved increasing the price per kilowatt-hour and the fixed energy charge to address part of the electricity sector deficit. From 2021 to 2023, the price per kWh varied across consumer categories. Thus:
- Low voltage consumers have seen their consumption price per kWh decrease since 2018, dropping from 74 FCFA/kWh in 2018 to 70.9 FCFA/kWh in 2023. This category of consumers benefits from the Government's Social Program PSGOUV initiated in 2019. By the end of December 2023, the number of beneficiaries of the tariff reduction stood at 2,049,202, including 224,807 on post-payment (11.0%) and 1,824,395 on prepayment (89.0%).
- Consumers in the medium and high voltage categories have experienced successive increases in the price per kWh of 1.5% in 2022 and 6.3% in 2023 to address part of the electricity sector deficit.
|
Evolution of Average Electricity Selling Prices (FCFA/kWh) excluding tax |
|||
|
Year |
Low Voltage |
Medium and High Voltage |
General Average |
|
2023 |
70.9 |
71.2 |
71 |
|
2022 |
70 |
67 |
68 |
|
2021 |
71 |
66 |
69 |
|
2020 |
71 |
66 |
69 |
|
2019 |
72 |
66 |
69 |
|
2018 |
74 |
66 |
70 |
|
2017 |
73 |
65 |
69 |
|
2016 |
72 |
63 |
68 |
|
2015 |
71 |
63 |
67 |
Source : CI-Energies, statistical brochure
Perspectives
The development of the sector is based on an investment plan aimed at 2030, which will address the demand, which has an average annual growth of 8%. This plan includes the construction of various production, transportation, and distribution facilities. Its financing is ensured at the production level by the State (hydroelectric dams) and Public-Private Investors (thermal power plants). Investments in transportation and distribution are guaranteed by the State.
The current energy mix is 69% thermal and 31% renewable, and it is expected to shift to 55% thermal and 45% renewable by 2030.
The installed capacity of the production fleet is projected to reach 4,463 MW by 2030, compared to 2,907 MW at the end of 2023.
The coverage and access rates will reach 100% by 2030 at the latest.
The quality of electricity supplied in Côte d'Ivoire will improve. The Average Outage Time (AOT) expected in 2030 is 4 hours, a significant improvement compared to the lowest recorded outage time of 16.4 hours in 2020.
The overall efficiency expected in 2030 is 88%, compared to 85.99% in 2023, representing a gain of 2.01 points, corresponding to an increase of 2.3%.
Lengths of Lines and Cables (km)
|
Year |
2015 |
2016 |
2017 |
2018 |
2019 |
2020 |
2021 |
|
High Voltage |
4,733 |
5,133 |
5,133 |
5,454 |
6,062 |
7,103 |
7,475 |
|
Medium Voltage |
22,336 |
23,516 |
24,026 |
24,534 |
25,432 |
26,163 |
27,914 |
|
Low Voltage |
19,599 |
20,746 |
21,233 |
21,651 |
22,523 |
23,794 |
24,559 |
Source: Ministry of Mines, Petroleum and Energy, CI-ENERGIES Directory
Electricity Access Indicators
|
Year |
2017 |
2018 |
2019 |
2020 |
2021 |
|
Number of Electrified Localities |
3,887 |
4,093 |
5,077 |
6,081 |
6,855 |
|
Number of Non-Electrified Localities |
4,628 |
4,423 |
3,522 |
2,612 |
1,958 |
|
Coverage Rate |
46% |
48% |
59% |
70% |
78% |
|
Access Rate * |
79% |
80% |
83% |
88% |
92% |
* Populations of Electrified Localities / Total Population; Estimated Population considering the 2014 RGPH
Source: Ministry of Mines, Petroleum and Energy, CI-ENERGIES Directory
Electricity Exports (GWh)
| Year | Ghana | Benin+Togo | Burkina | Mali | Liberia | CLSG* | Total |
| 2015 | 227 | 13 | 382 | 248 | 2 | - | 872 |
| 2016 | 575 | 222 | 571 | 281 | 7 | - | 1,656 |
| 2017 | 242 | 73 | 583 | 340 | 9 | - | 1,247 |
| 2018 | 141 | - | 561 | 444 | 10 | - | 1,156 |
| 2019 | 127 | - | 506 | 609 | 13 | - | 1,255 |
| 2020 | 58 | - | 489 | 768 | 18 | - | 1,333 |
| 2021 | 43 | - | 412 | 411 | 21 | 1.4 | 888 |
| Total | 1,413 | 308 | 3,504 | 3,101 | 80 | 1.4 | 8,407 |
*CLSG Project: Electricity Supply to Liberia, Sierra Leone, and Guinea
Source: MMEP
Gross Production of the Interconnected Electricity Network from 2015 to 2021 (GWh)
|
Year |
2015 |
2016 |
2017 |
2018 |
2019 |
2020 |
2021 |
|
Thermal Production |
7,255.40 |
8,543.30 |
7,893.60 |
7,028 |
7,125 |
7,828 |
8,793 |
|
Hydroelectric Production |
1,352.50 |
1,528.60 |
2,047.20 |
2,962 |
3,480 |
3,376 |
2,627 |
|
Total Production |
8,607.90 |
10,071.90 |
9,940.80 |
9,990 |
10,605 |
11,204 |
11,420 |
|
Hydroelectric Share |
15.71% |
15.18% |
20.59% |
29.65% |
32.81% |
30.13% |
23.00% |
Source: Ministry of Mines, Petroleum and Energy, CI-ENERGIES Directory
